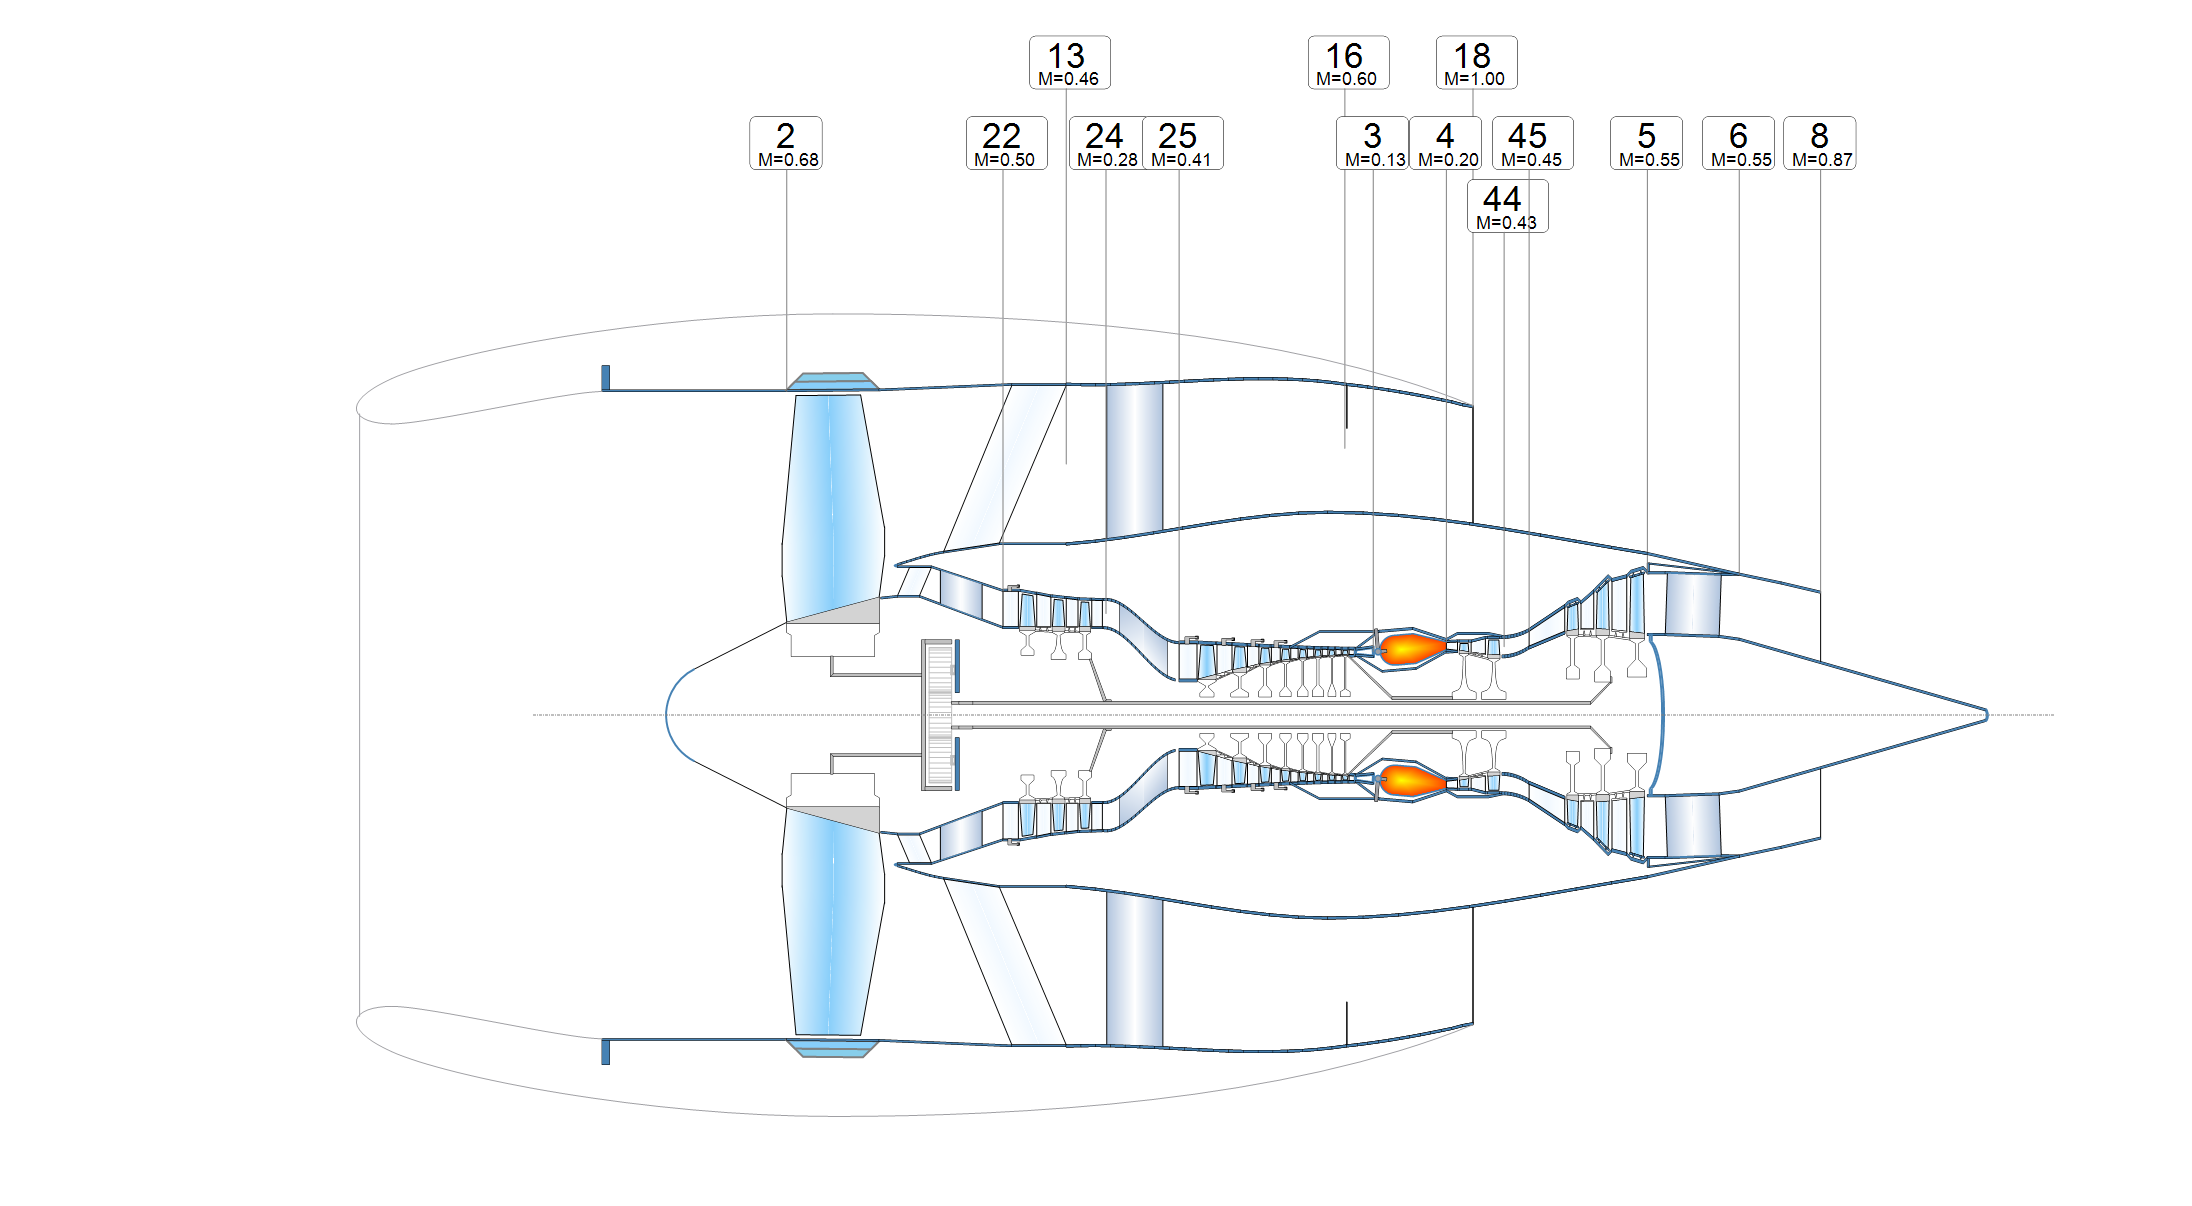
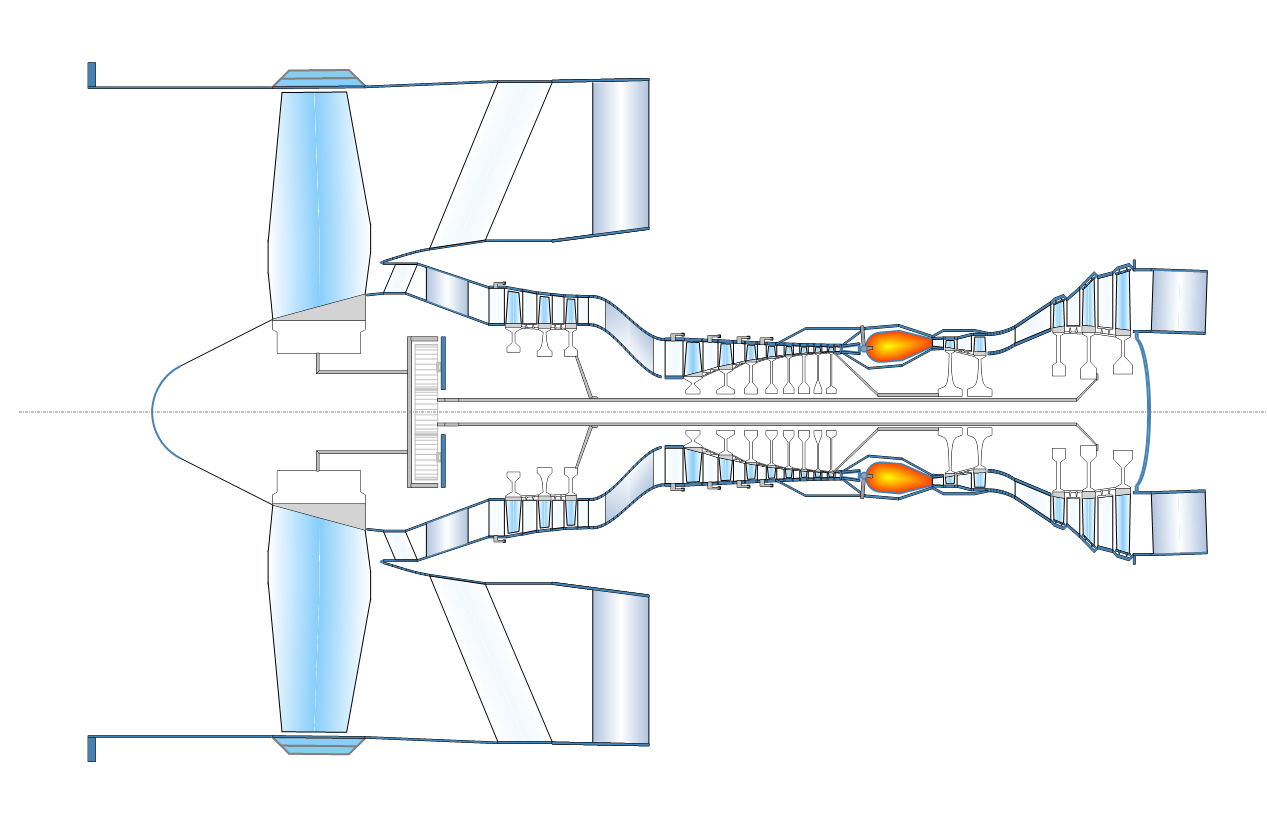
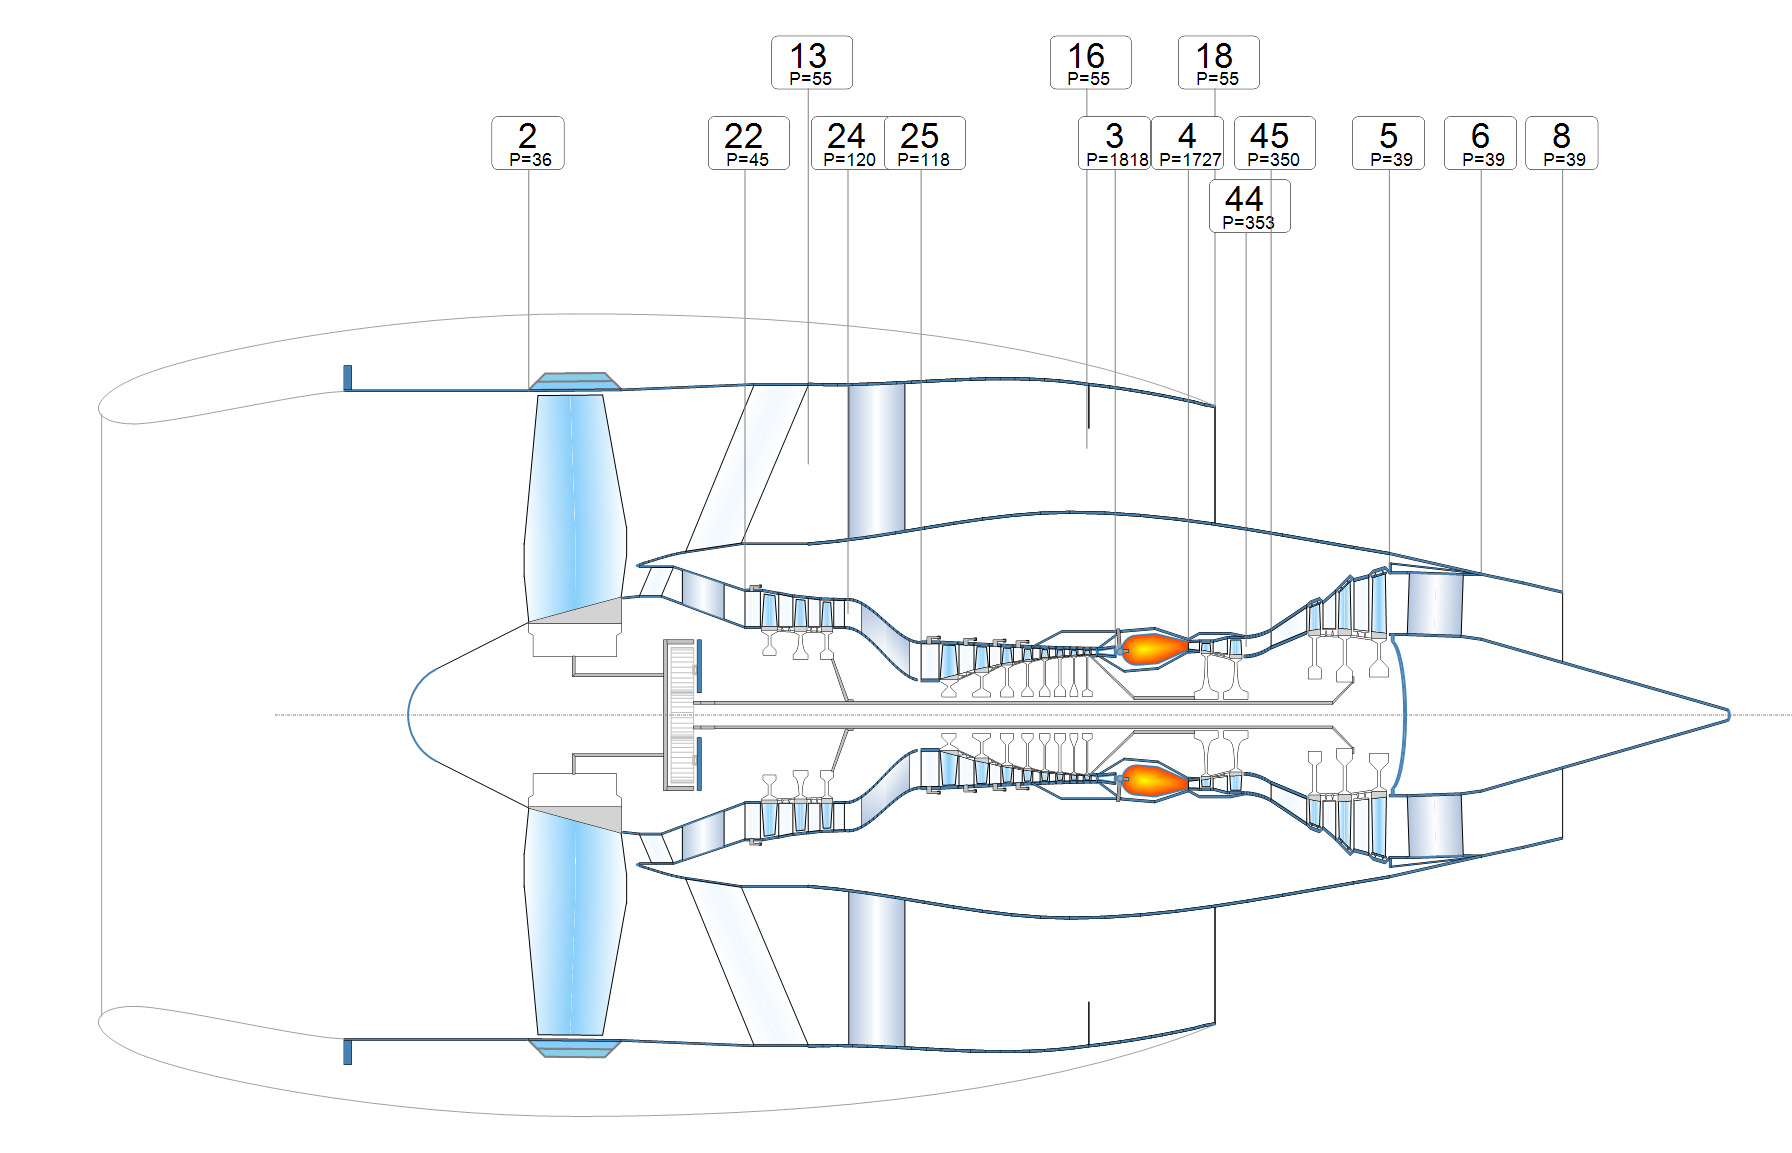
From here you can download Sankey (Energy) and Grassmann (Exergy) diagrams as well as temperature-entropy diagrams. Engine cross-sections show the exact position of the thermodynamic stations, together with the local temperatures, pressures, velocities, and Mach numbers.
Diagrams drawn to scale are much more useful than cartoons, which only illustrate principles rather than facts. All of the diagrams shown here are to scale.
Send me a GasTurb input file and I will create the corresponding diagrams for your specific data!
All the figures and diagrams are licensed under Attribution 4.0 International (CC BY 4.0) See: https://creativecommons.org/licenses/by/4.0/legalcode
Energy flows in a Two Spool Unmixed Flow Turbofan
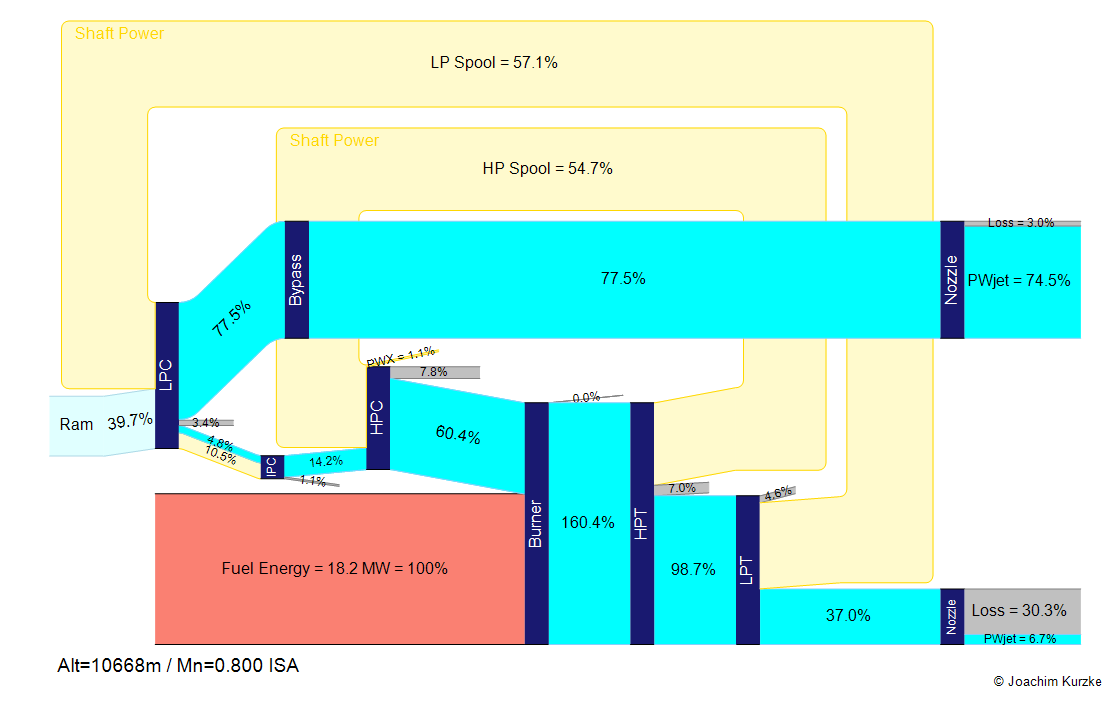
Interestingly, the energy flows within the turbofan are much greater than the useful energy at the engine's exhaust. It is also evident that the amount of energy flowing through a component has little to do with its size.
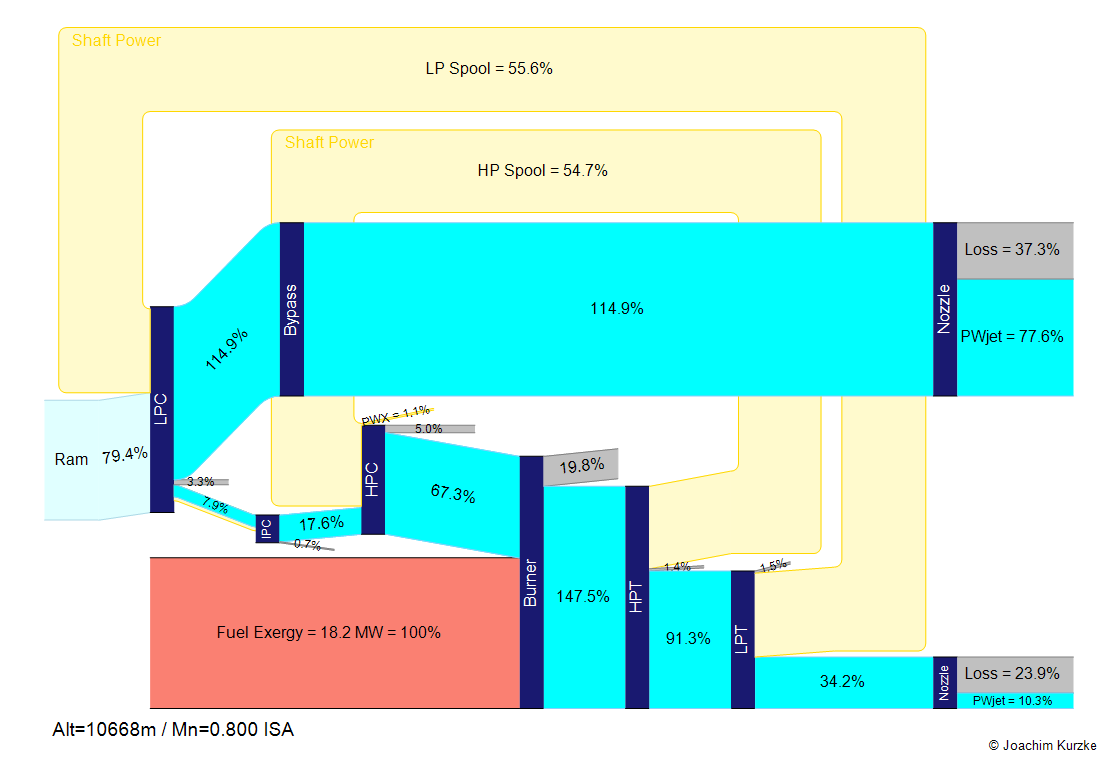
Exergy destruction in a Two Spool Unmixed Flow Turbofan
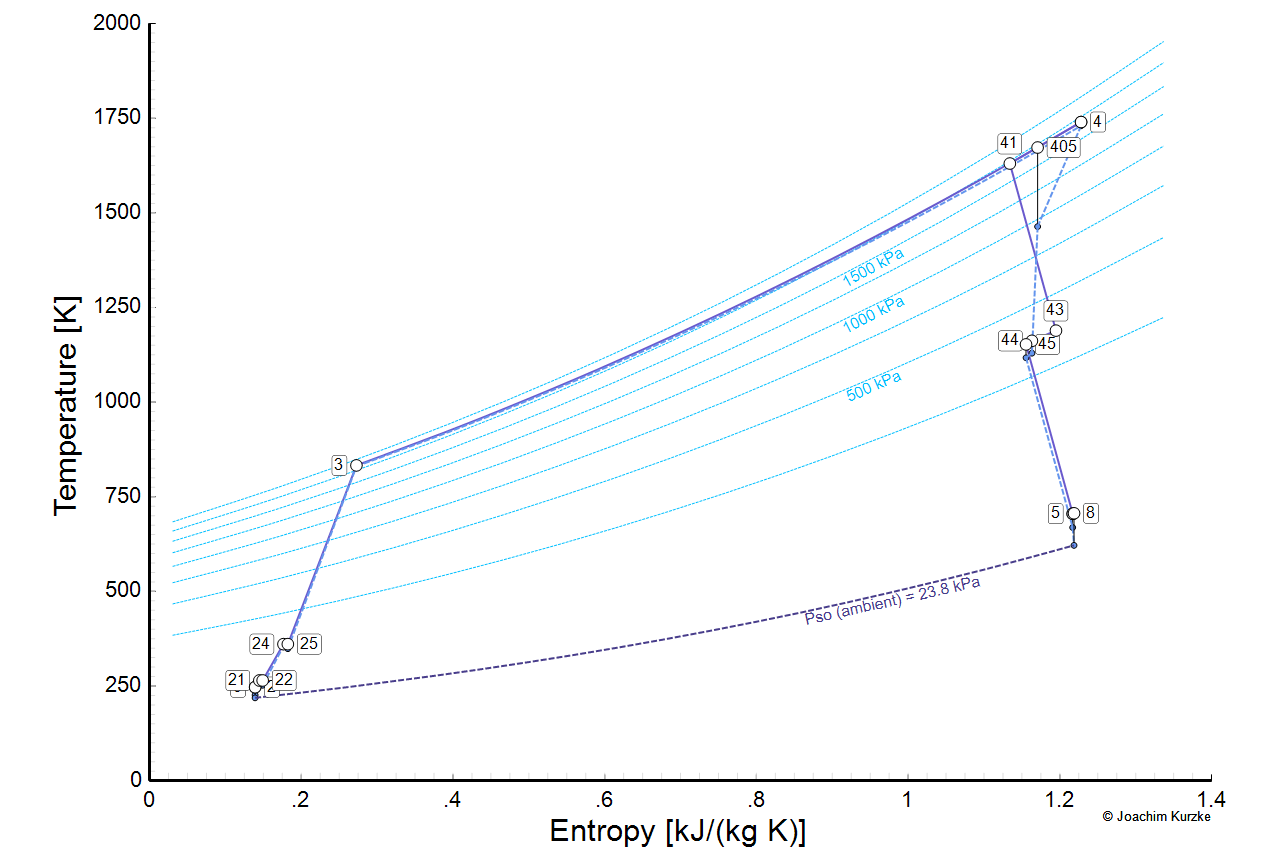
The thermodynamic cycle of the core stream.
The solid lines mark the total temperature, dashed lines mark the static temperature
Engine cross-section
Total pressure at the thermodynamic stations
Total temperature at the thermodynamic stations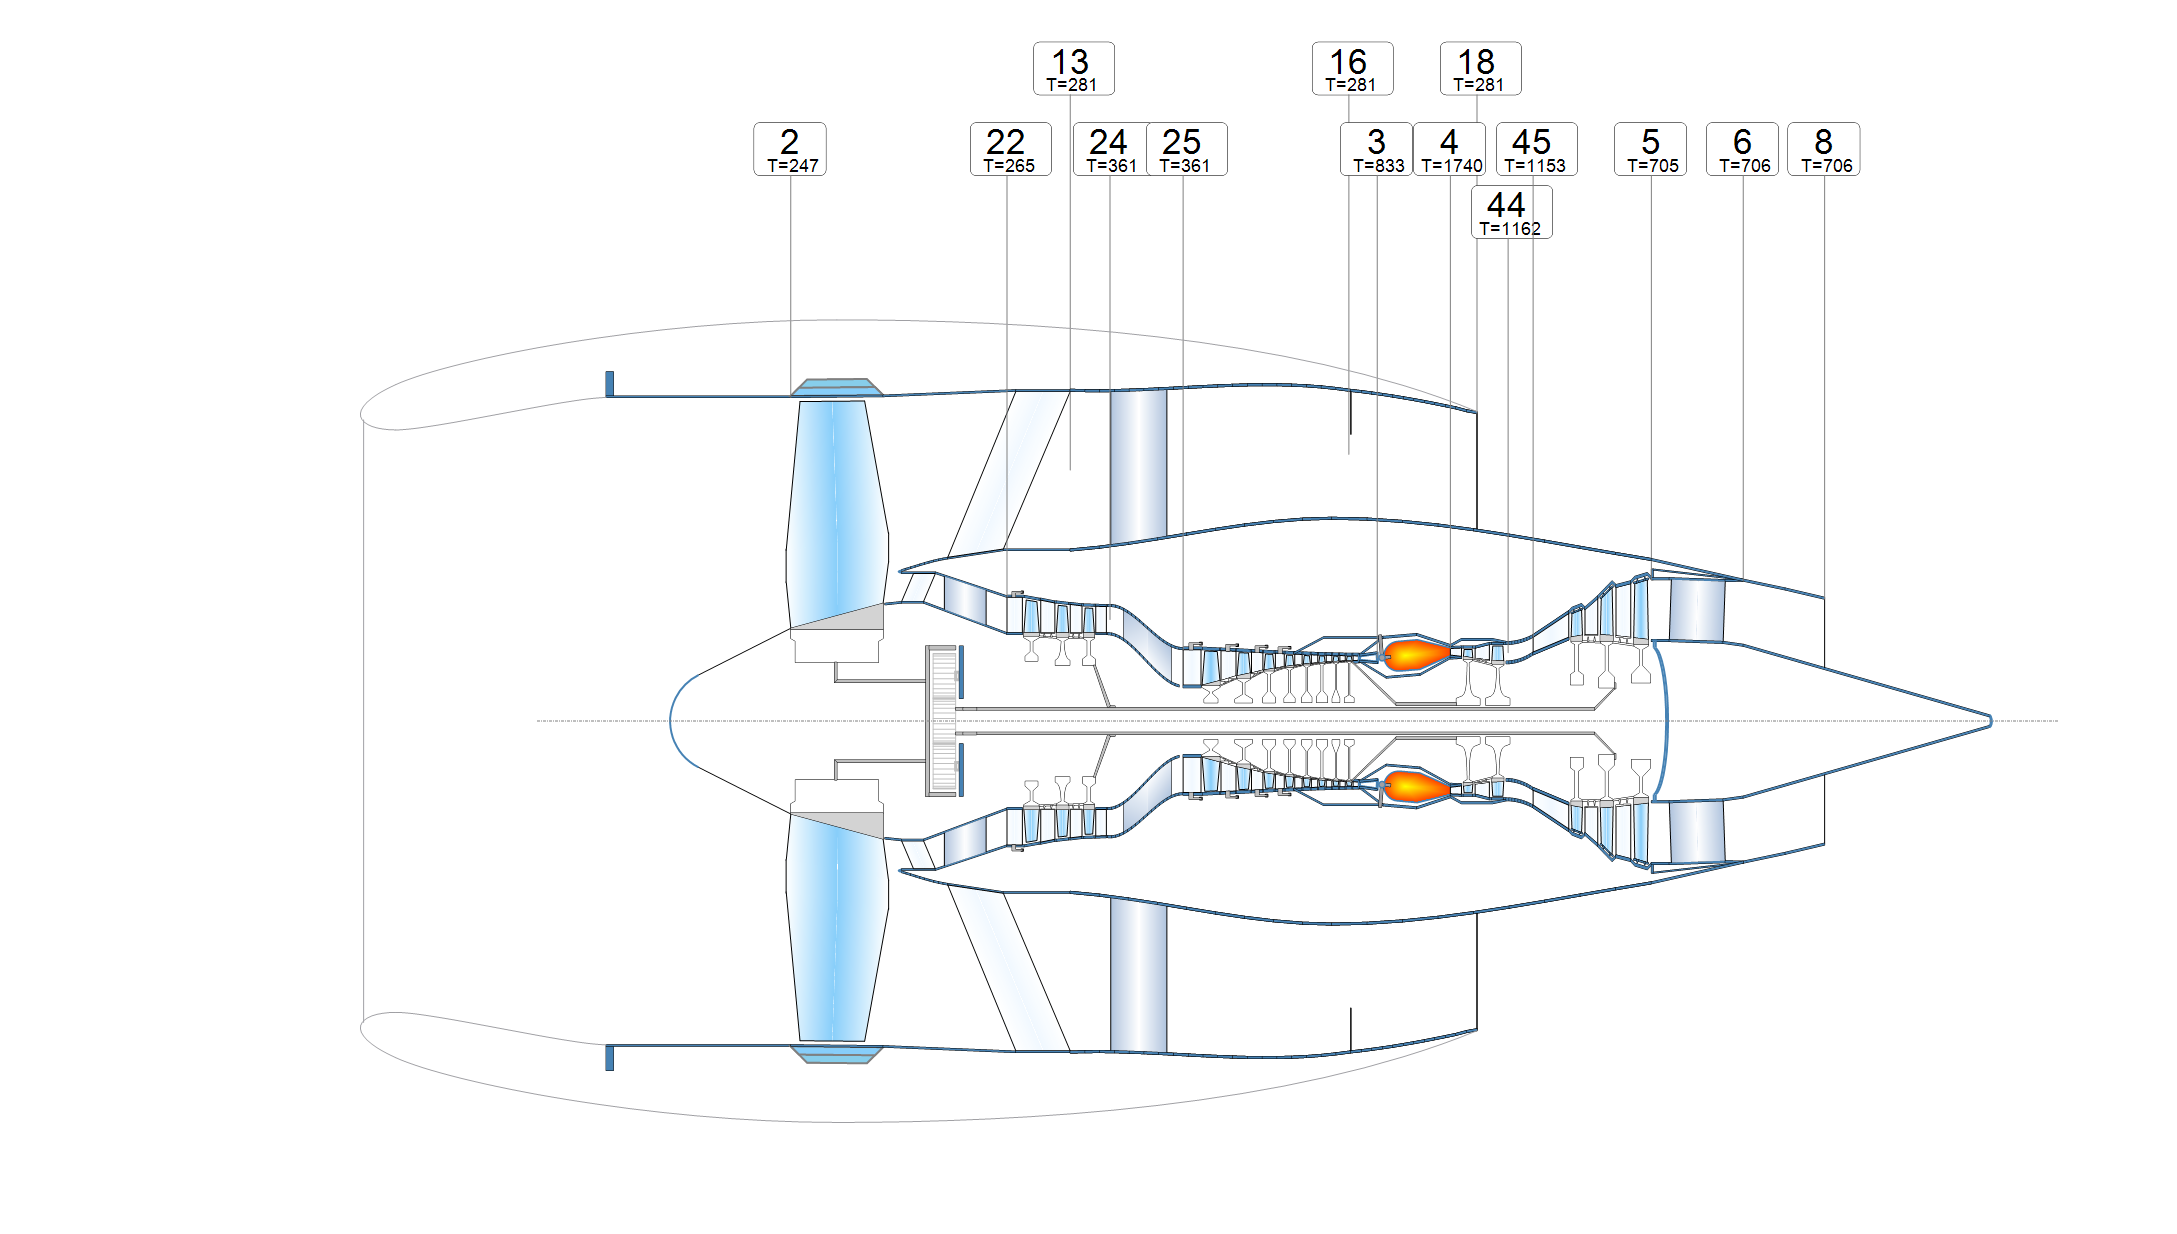
Gas velocity at the thermodynamic stations
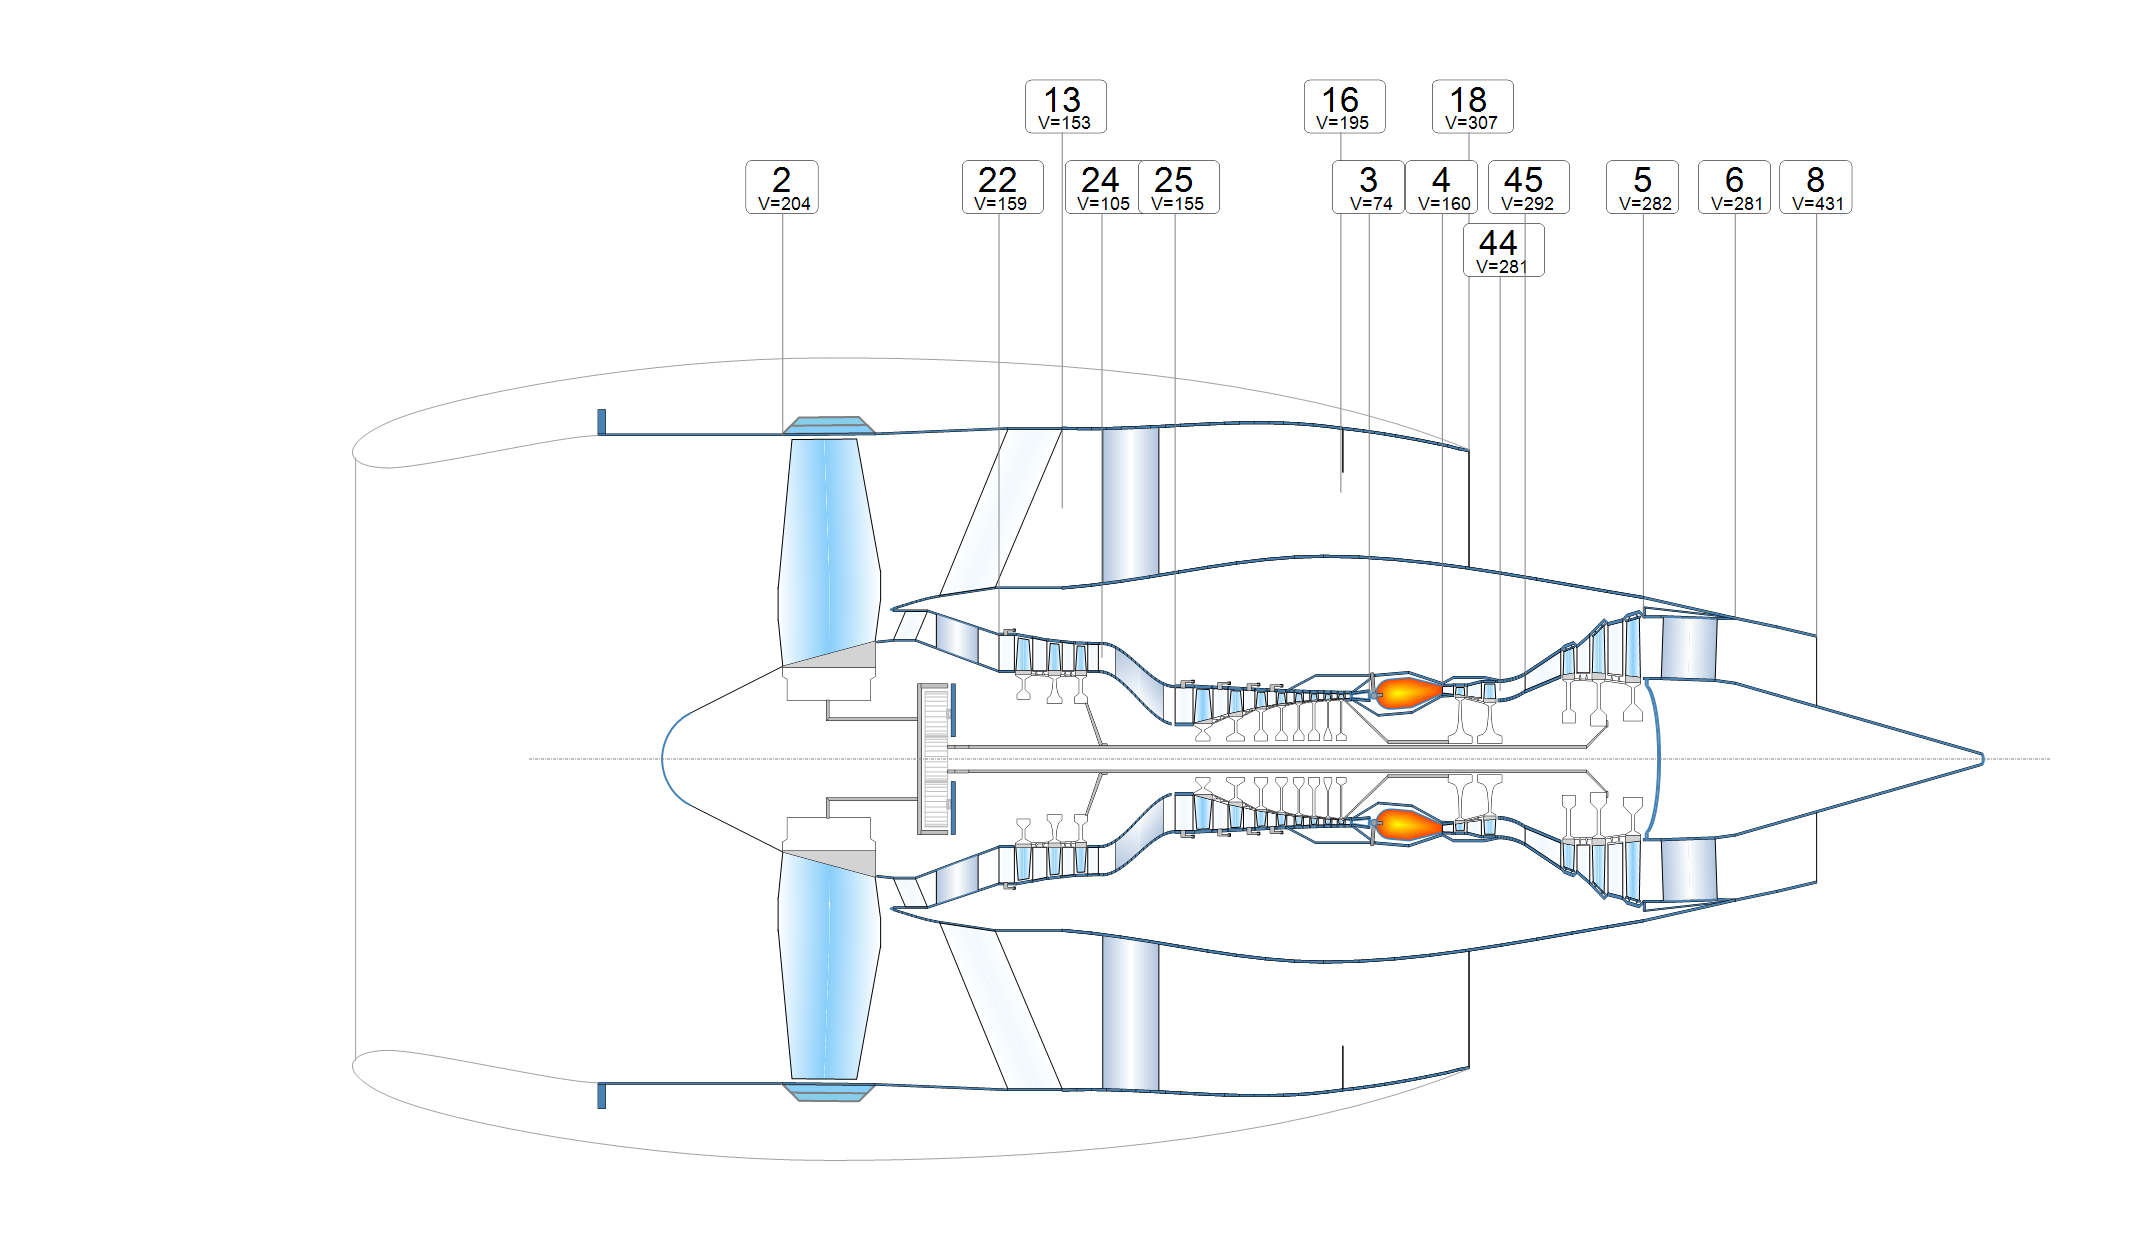
Mach number at the thermodynamic stations