The Website of the GasTurb Inventor


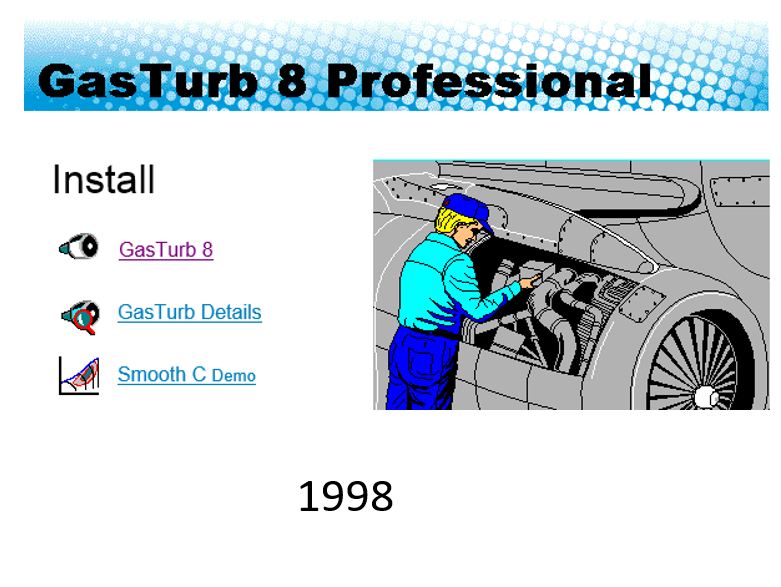
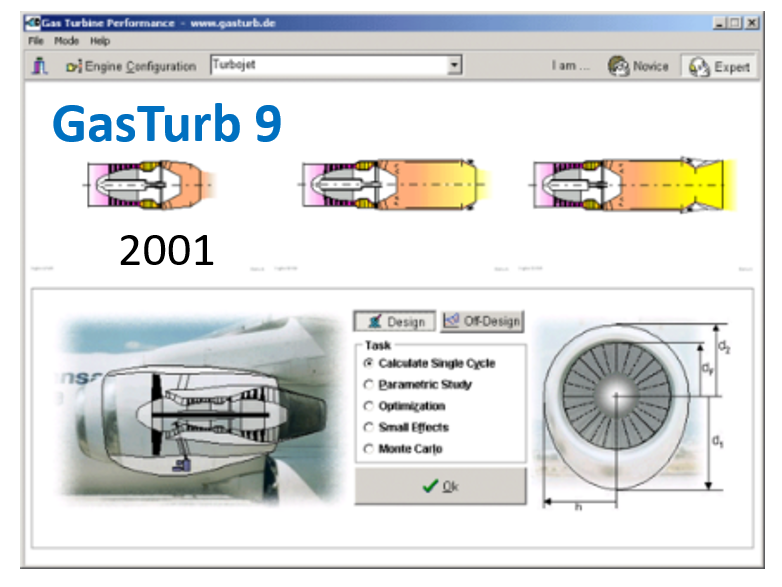
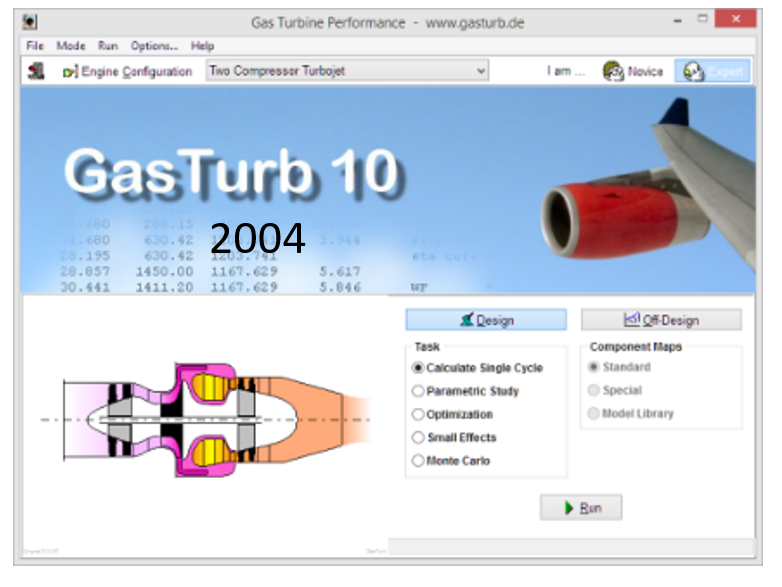
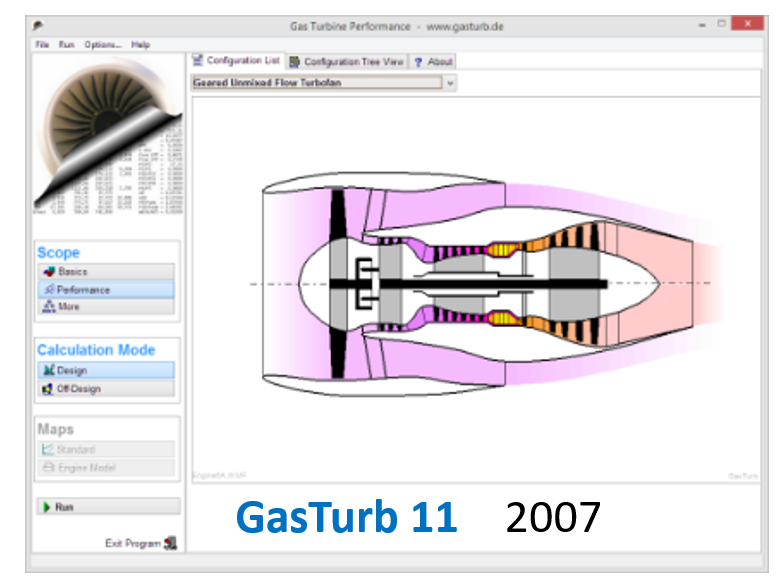
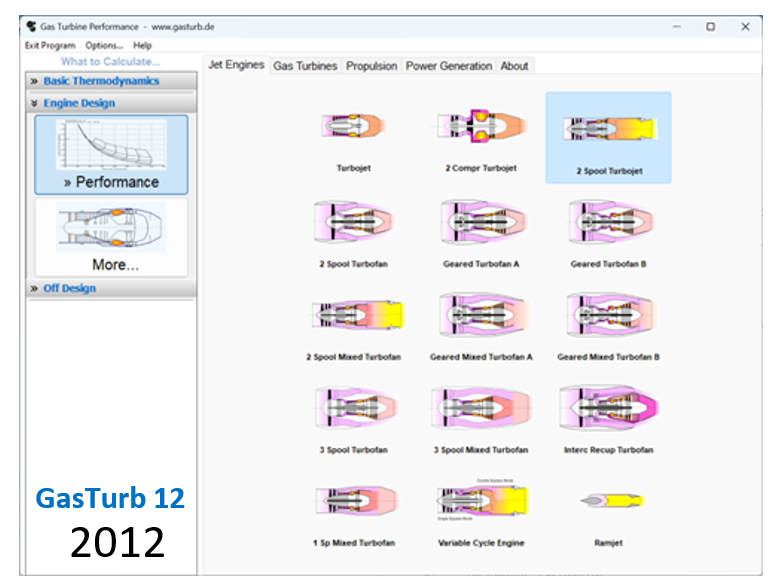
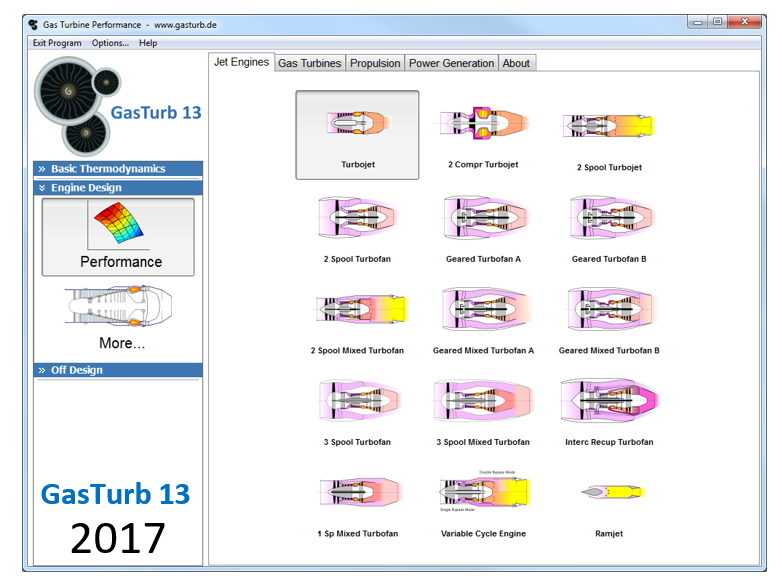
GasTurb is a program that calculates the performance of gas turbines used for aircraft propulsion and power generation. This website is a valuable resource for anyone using GasTurb or other performance software such as NPSS, PROOSIS, PyCycle and T-MATS. Here, you can find information about modeling contemporary engines, compressor and turbine maps, technically oriented tutorials, other teaching material, and my recent publications. And finally, you can read about the history of GasTurb.
In 2013 the ownership of GasTurb 12 and the accompanying software was transferred to the newly founded GasTurb GmbH in Aachen, Germany. I continued to support the further GasTurb development with my experience. Thanks to this fruitful cooperation, we were able to create an even more powerful release, named GasTurb 13. This software kept the established structure, technical standards, and engineering approach, while also introducing some enhancements to the easy-to-learn, user-friendly graphical interface.
In October 2019 GasTurb GmbH declared the end of collaboration.
Since retiring from MTU Aero Engines, I have been working as a freelancer in the field of gas turbine performance. My research interests include software with intuitive user interfaces, special graphical output formats, automatic identification of dubious inputs and results, robust algorithms, and exceptional simulation tasks. I share the results of my research on this website, and I present them at conferences, seminars, and workshops with my consulting clients.
GasTurb is now a trademark of GasTurb GmbH, Aachen, Germany
I've added a sitemap that can be selected from the menu. I hope it helps you navigate this website.
Various illustrations related to gas turbine performance have been added. Feel free to use them in publications or for teaching purposes.
last updated 6 October 2026
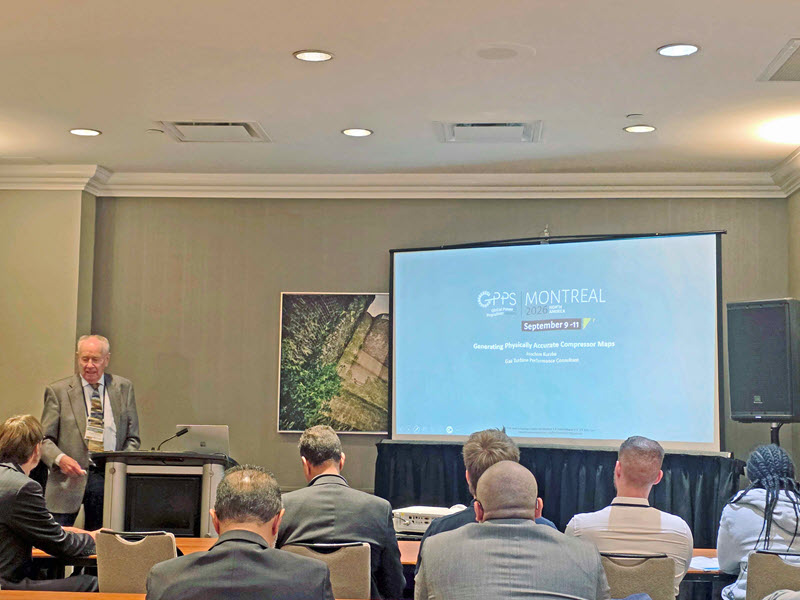
From September 9th to 11th, I attended the GPPS Technical Conference 2026 in Montreal, Canada. There, I gave a presentation on creating physically accurate map tables from compressor rig data, which inevitably exhibit some degree of scatter. High-quality compressor maps are the key to precise gas turbine performance calculations.
Directly smoothing efficiency contour lines, as many others do, is not the right approach because there is no physical law that dictates what such lines should look like. Rather than focusing on efficiency, I recommend using the correlations of torque/flow and pressure ratio versus flow to create a smooth map.
I used measured data from eight different compressors to show that, in all cases, the torque/flow versus flow lines are straight and parallel in the most important map region.
My recommendation: Check the maps you are using with your performance program by looking at the torque/flow versus flow lines. Are they straight and parallel in the upper left region of the map? This doesn't require much effort, but it's a valuable way to check the quality of your work!
You can download both the paper and the presentation I have shown from the "My publications" page.
Other Recent Publications
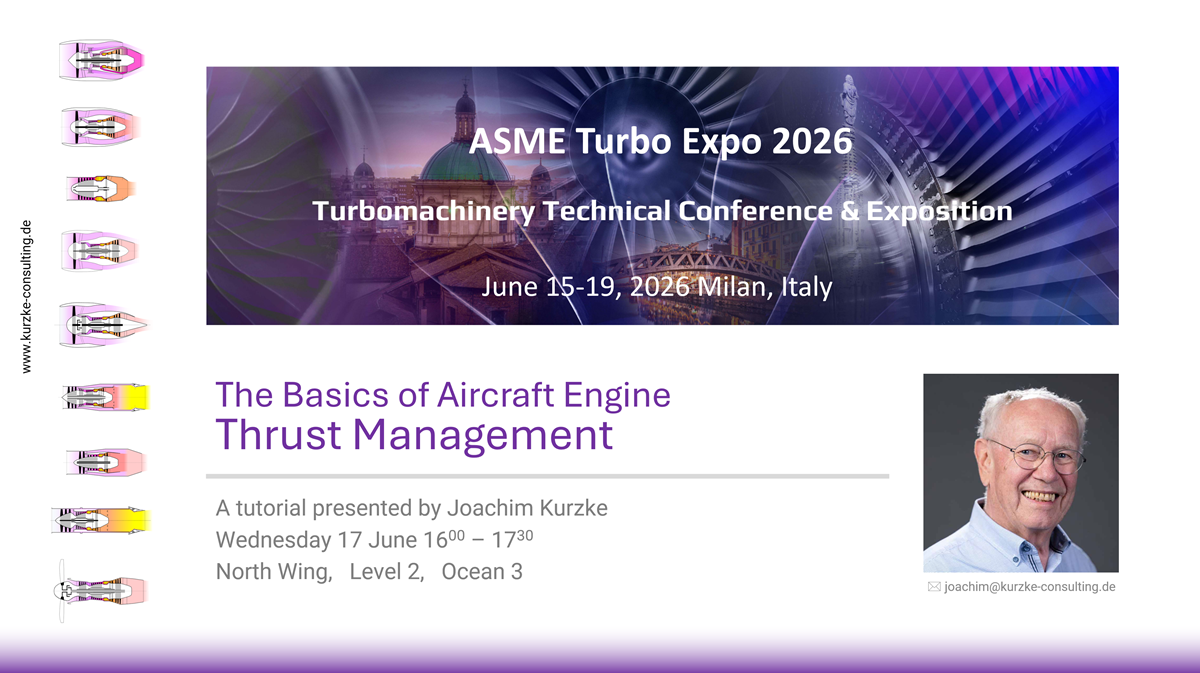
At the 2026 ASME Turbo Expo in Milan, Italy, I presented the tutorial "The Basics of Aircraft Engine Thrust Management." The event drew a significant crowd, with approximately 130 individuals in attendance. This and more tutorials are available for download free of charge from the Tutorials page.
I have presented the paper "Practice-Relevant Teaching of Gas Turbine Performance" at the GPPS conference 2025 in Shanghai. You can download both the paper and the presentation I have shown from the "My publications" page. This paper has been proposed for publication in the GPPS Journal.
Engine Models, Compressor and Turbine Maps
Two new turbofan engine models have recently been added to the Engine Models page: the CFM56 LEAP-1A and the PW1100G-JM. Both engines are used on the Airbus A320neo. Additionally, a model of the LM2500 was added as an example of a turboshaft. This machine's gas generator is another new engine model. It can be considered a turbojet.
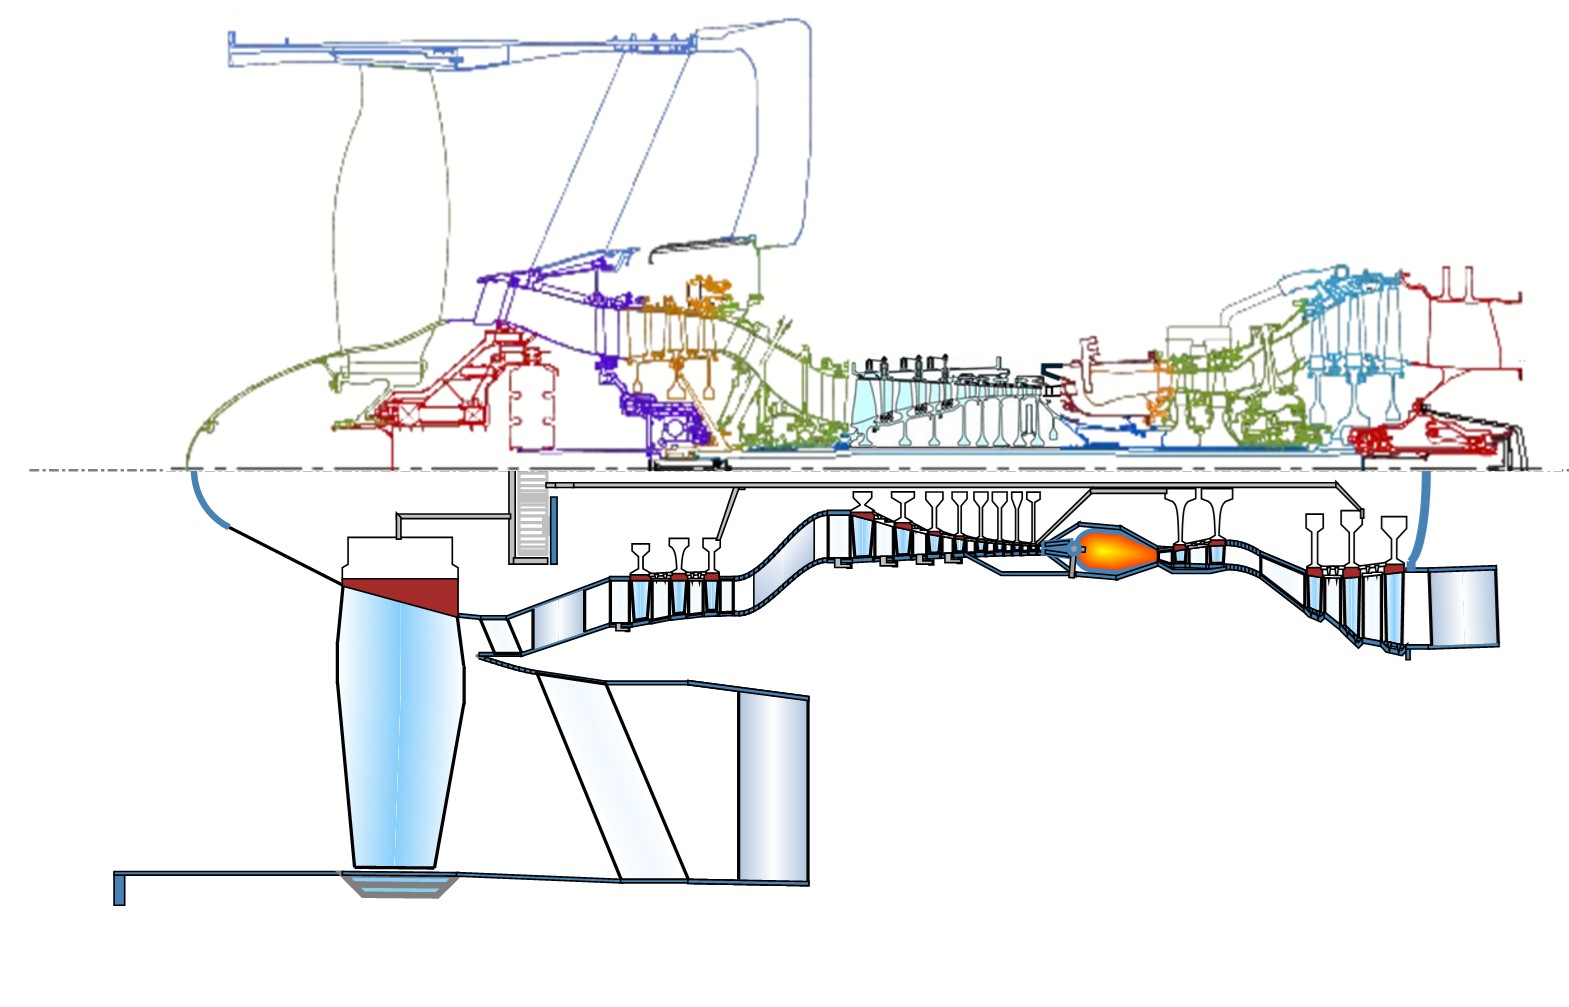
There are now 9 performance models of contemporary engines available. These include mixed-flow and separate-flow turbofans with bypass ratios ranging from 0.4 to 12; a two-spool turboshaft for power generation; and a gas generator model of this engine that could theoretically be used as a turbojet. Geometry models derived from thermodynamic cycle data are compared to engine cross sections found online. Additionally, Sankey diagrams illustrate energy flow within the engines, making the relative importance of the various components visible. Comparing Sankey diagrams of different engines can create a "wow effect."
Overall, there is ample material for teaching gas turbine performance in a practical way based on real data of contemporary engines.
Moreover, there are now 14 Compressor Maps and 2 Turbine Maps available for you to download in GasTurb and NPSS format.
Many of these maps are extended down to 1% spool speed. They are suitable for engine start and windmilling simulation.
30+ Years Ago
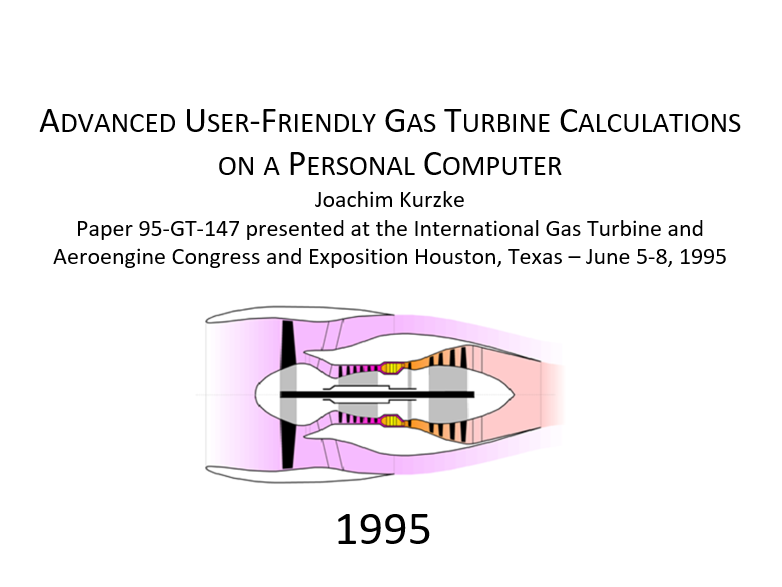
The history of GasTurb began in the early 1990s. I presented the first paper about it at the International Gas Turbine and Aeroengine Congress and Exposition, Houston, Texas, back in June 1995.
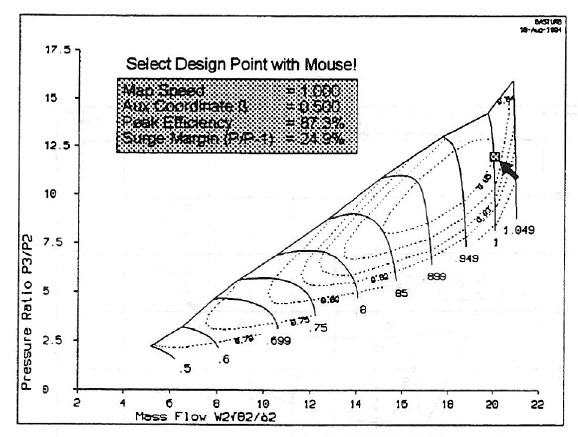
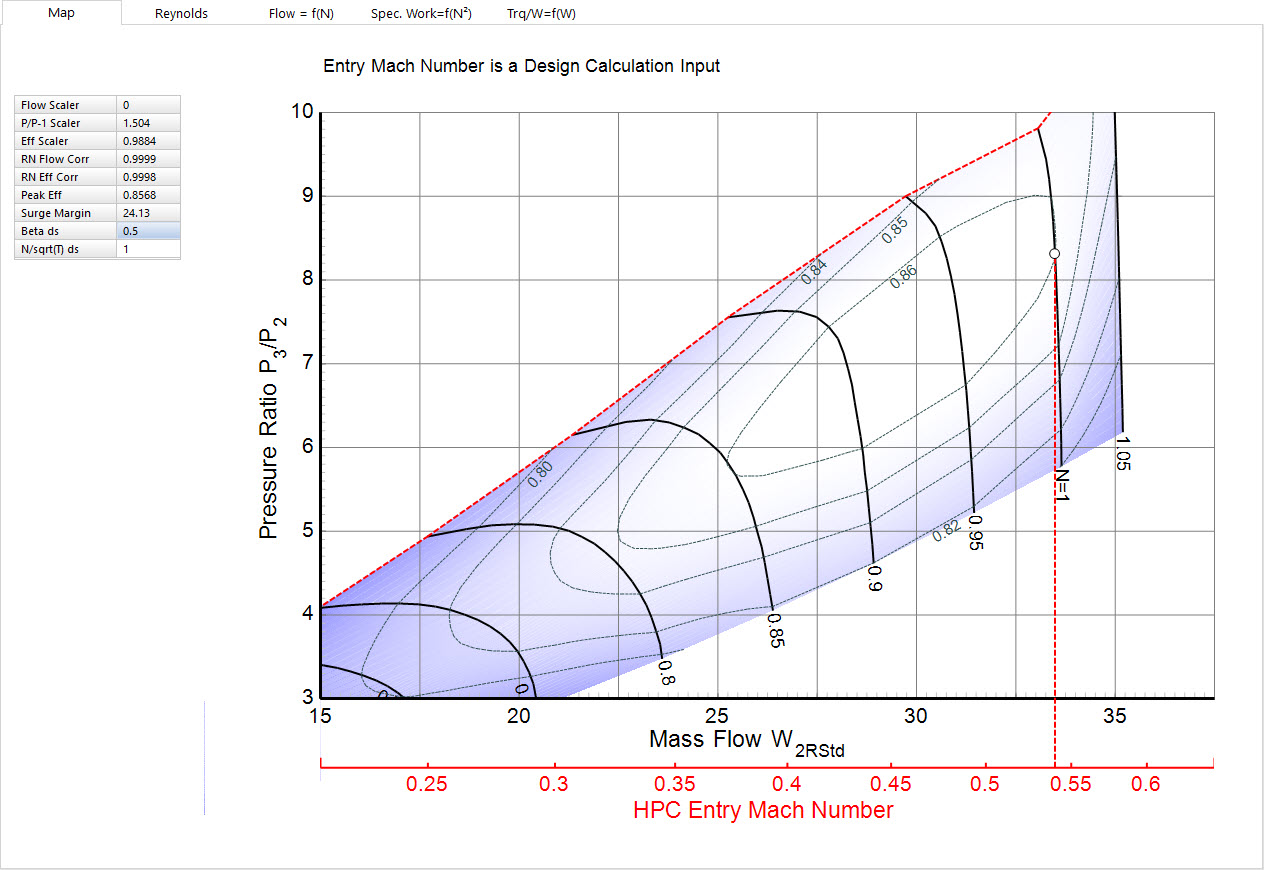
This is my today's version of the same figure:
Award
At Turbo Expo 2024 in London, the IGTI Aircraft Engine Committee surprised me with a "Thank you" for my contributions to the gas turbine performance community: