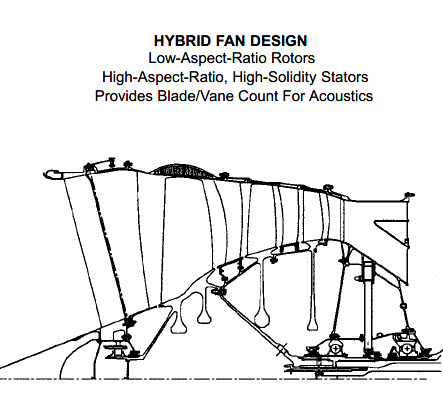
3-Stage Fan With Variable IGV's
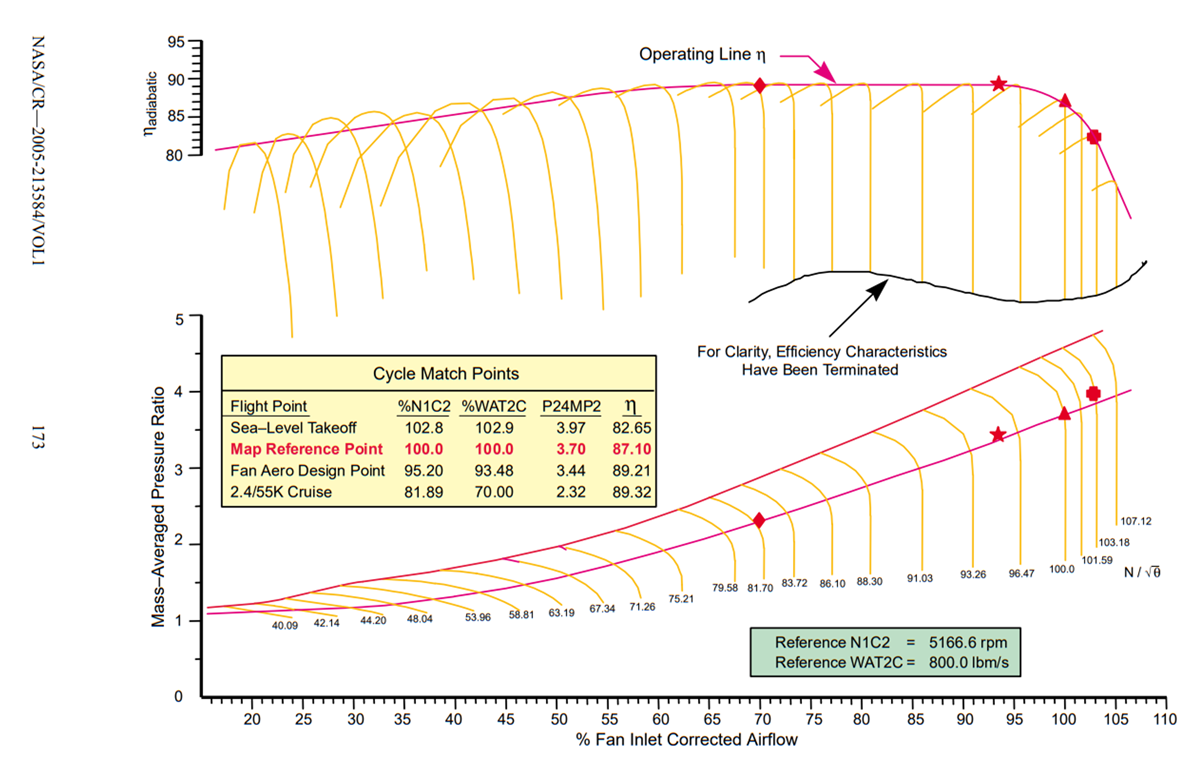
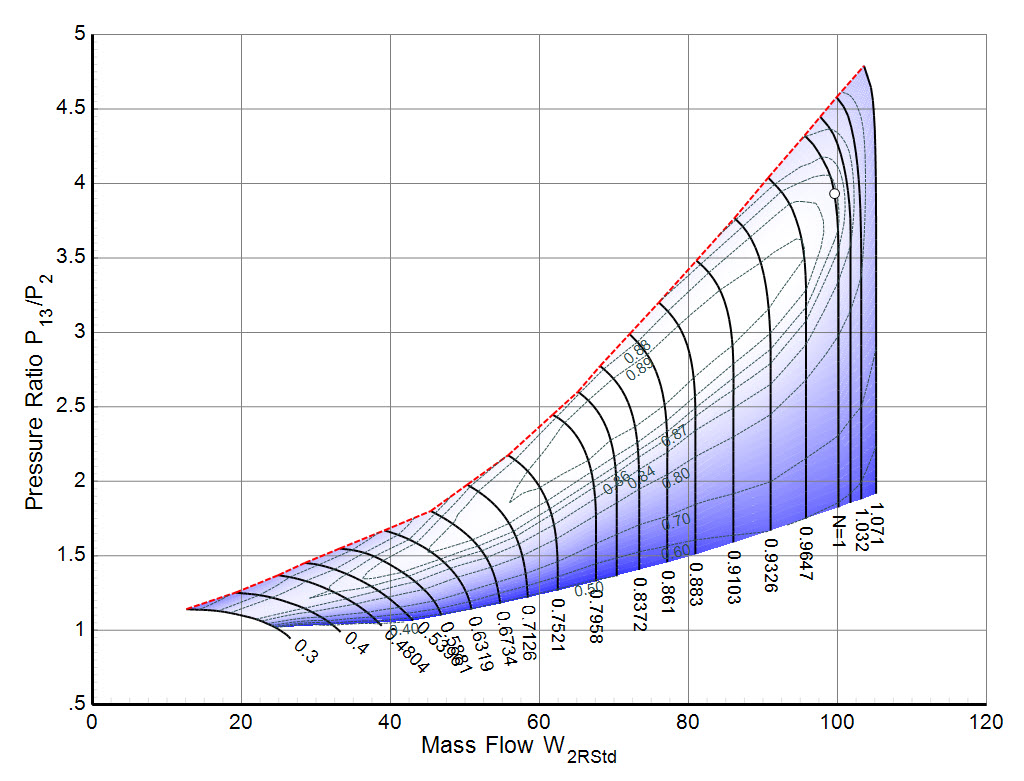
This is a predicted map of a compressor with a pressure ratio of 4.
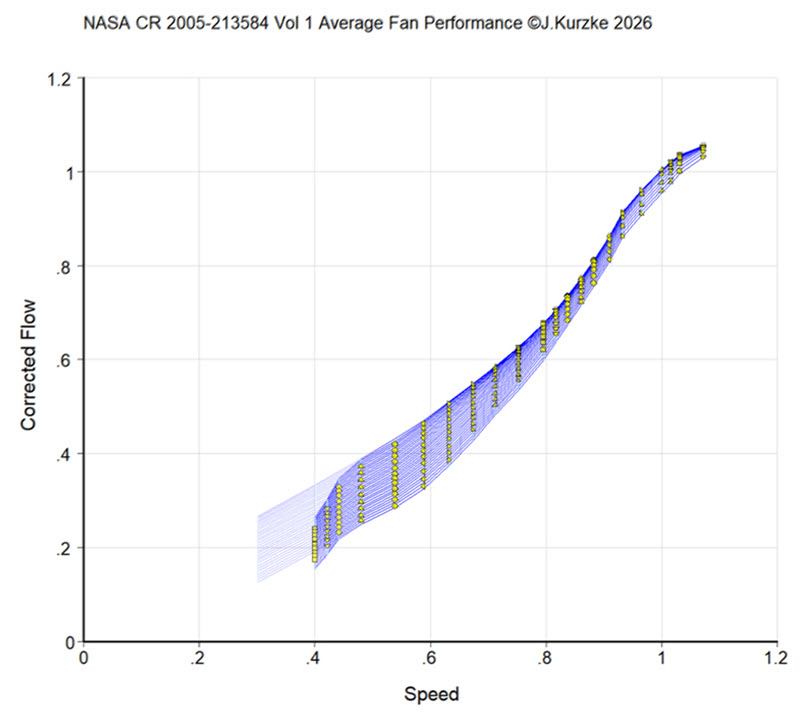
This compressor map has been evaluated in the context of writing the paper GPPS-TC-2026-0083. It was found that three speed lines are not consistent with the rest of the map, as can be seen on the 'Additional' page. The performance map offered for download ignores the suspicious data.
About this compressor
The map is based on the predicted map published in NASA CR-2005-213584, Figure 132.
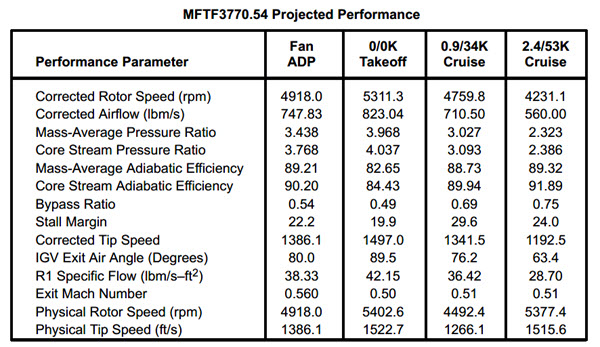
Reference:
Critical Propulsion Components Volume 1: Summary, Introduction, and Propulsion Systems Studies
Pratt & Whitney West Palm Beach, Florida, General Electric Aircraft Engines Cincinnati, Ohio
NASA/CR—2005-213584/VOL1
Figures of the given and the smooth map
Tables for use with performance programs
The map tables are available in two variants:
Note that the file extension must be changed to MAP after downloading if you want to use the map with GasTurb.
Additional figures from my experimental map smoothing program
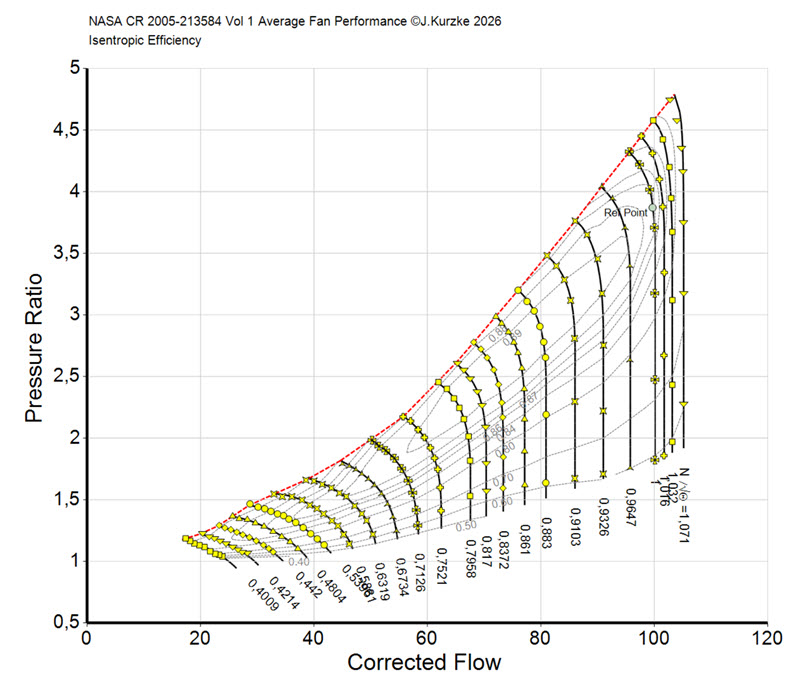
This map looks nice, but the three speed lines o.4009, 0.4214 and 0.442 are not consistent with the rest of the map. These speed lines were not taken into account when the final smooth map was generated. Instead, speed lines 0.3 and 0.4 were added and adjusted to match the rest of the map.
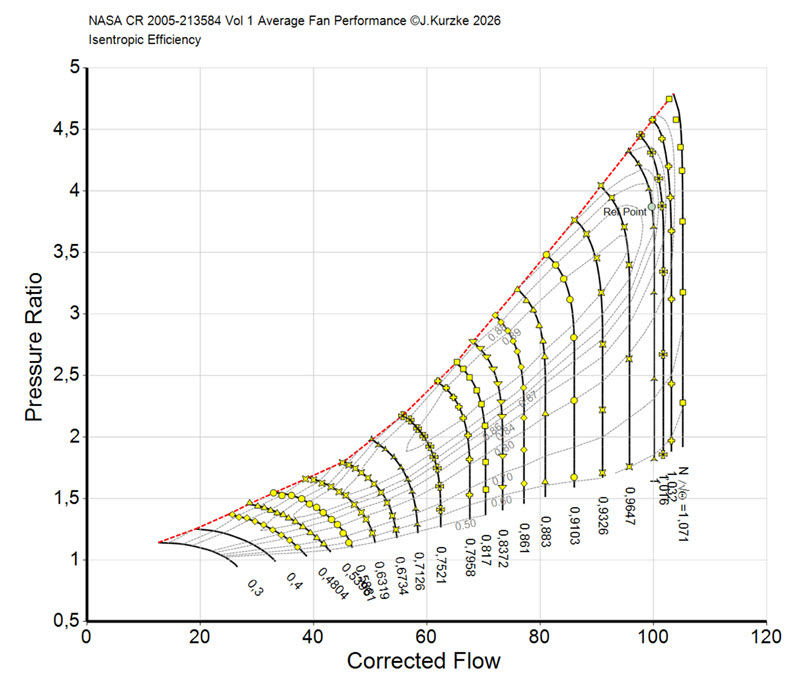
As can be seen in the next figure, the three suspect speed lines, when plotted as Trq/W=f(W), are not straight parallel lines.
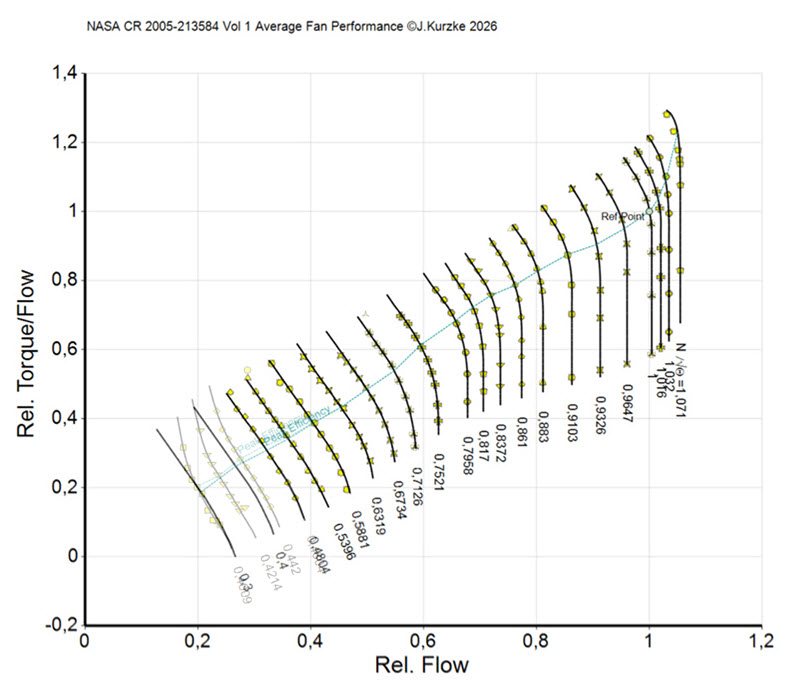
The following figure clearly shows that the correlation between flow speed and the given data is not as expected.
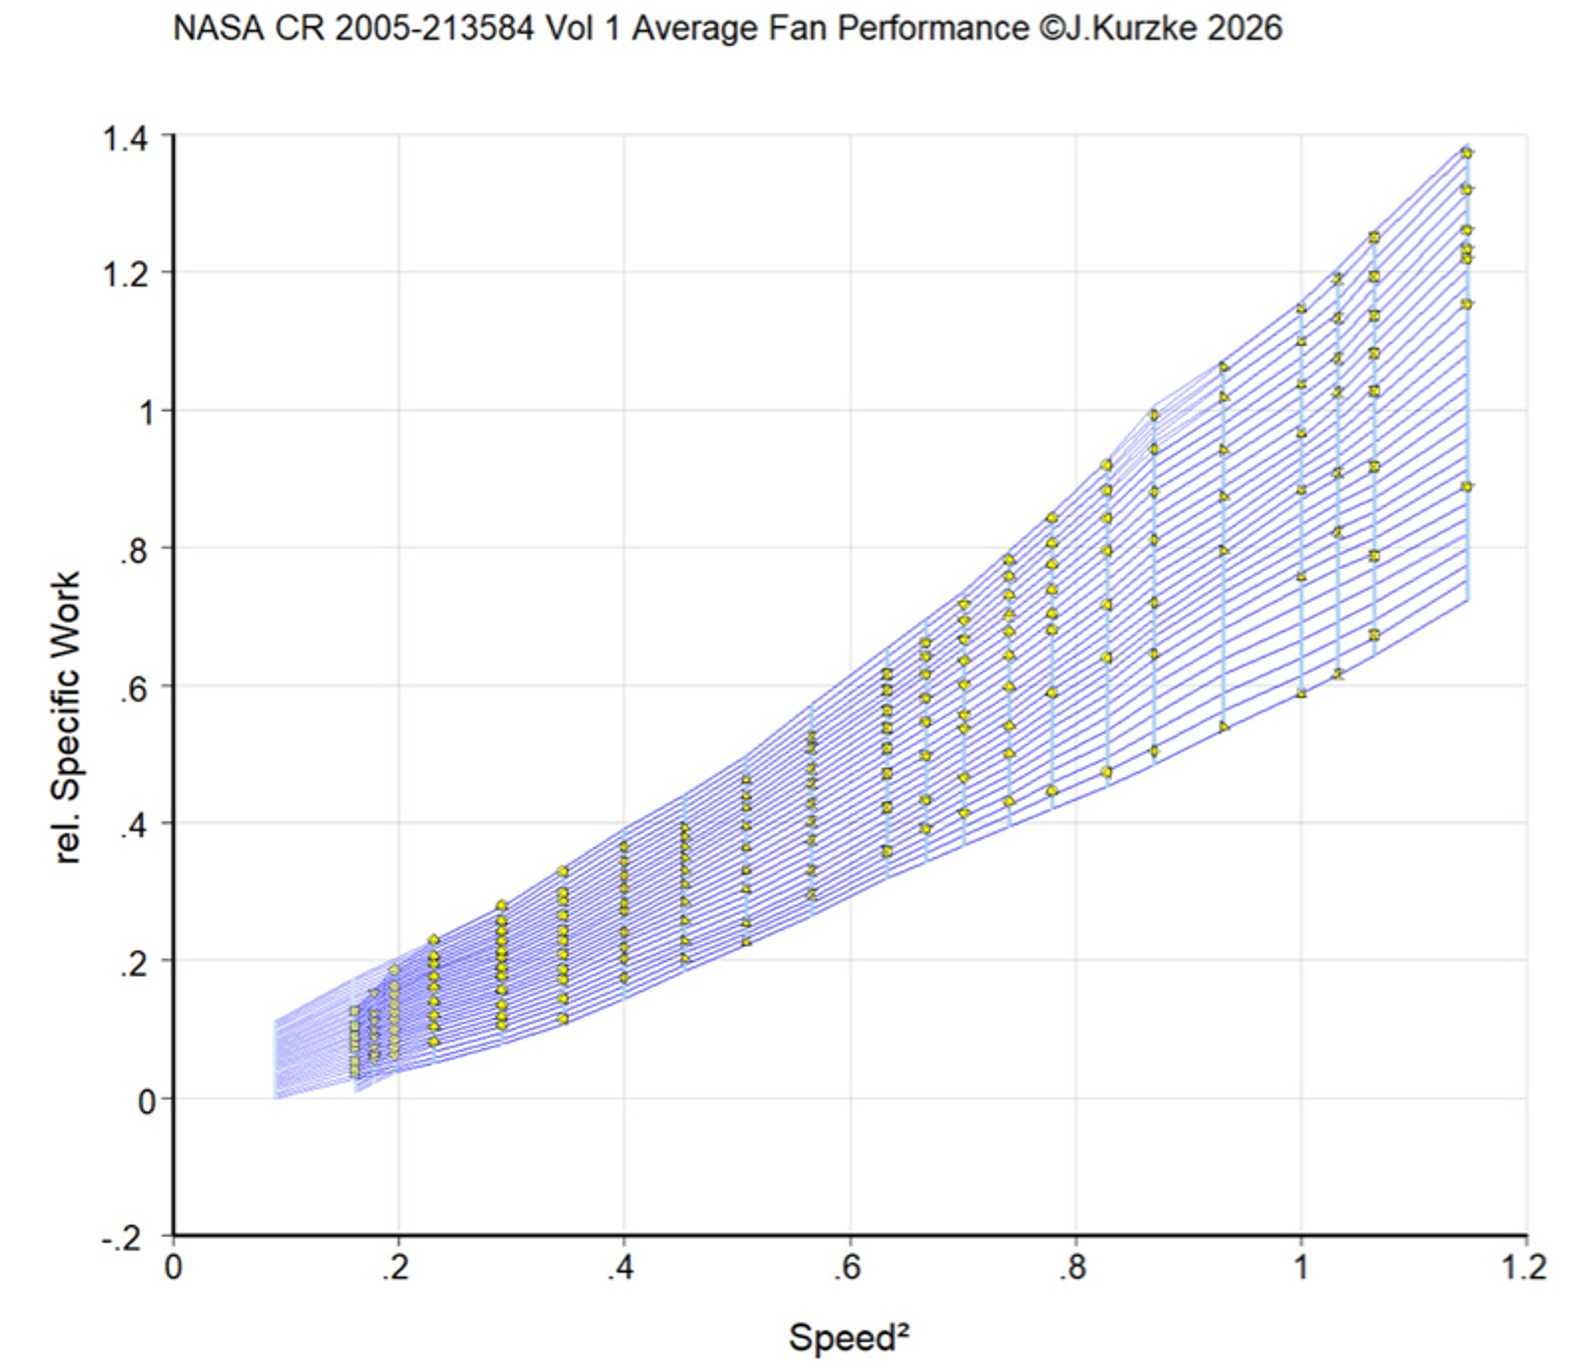
The work-speed² correlation of the given data is also suspicious: